Your Numbers Look Impressive. So Why Is Everyone Scrolling Past?
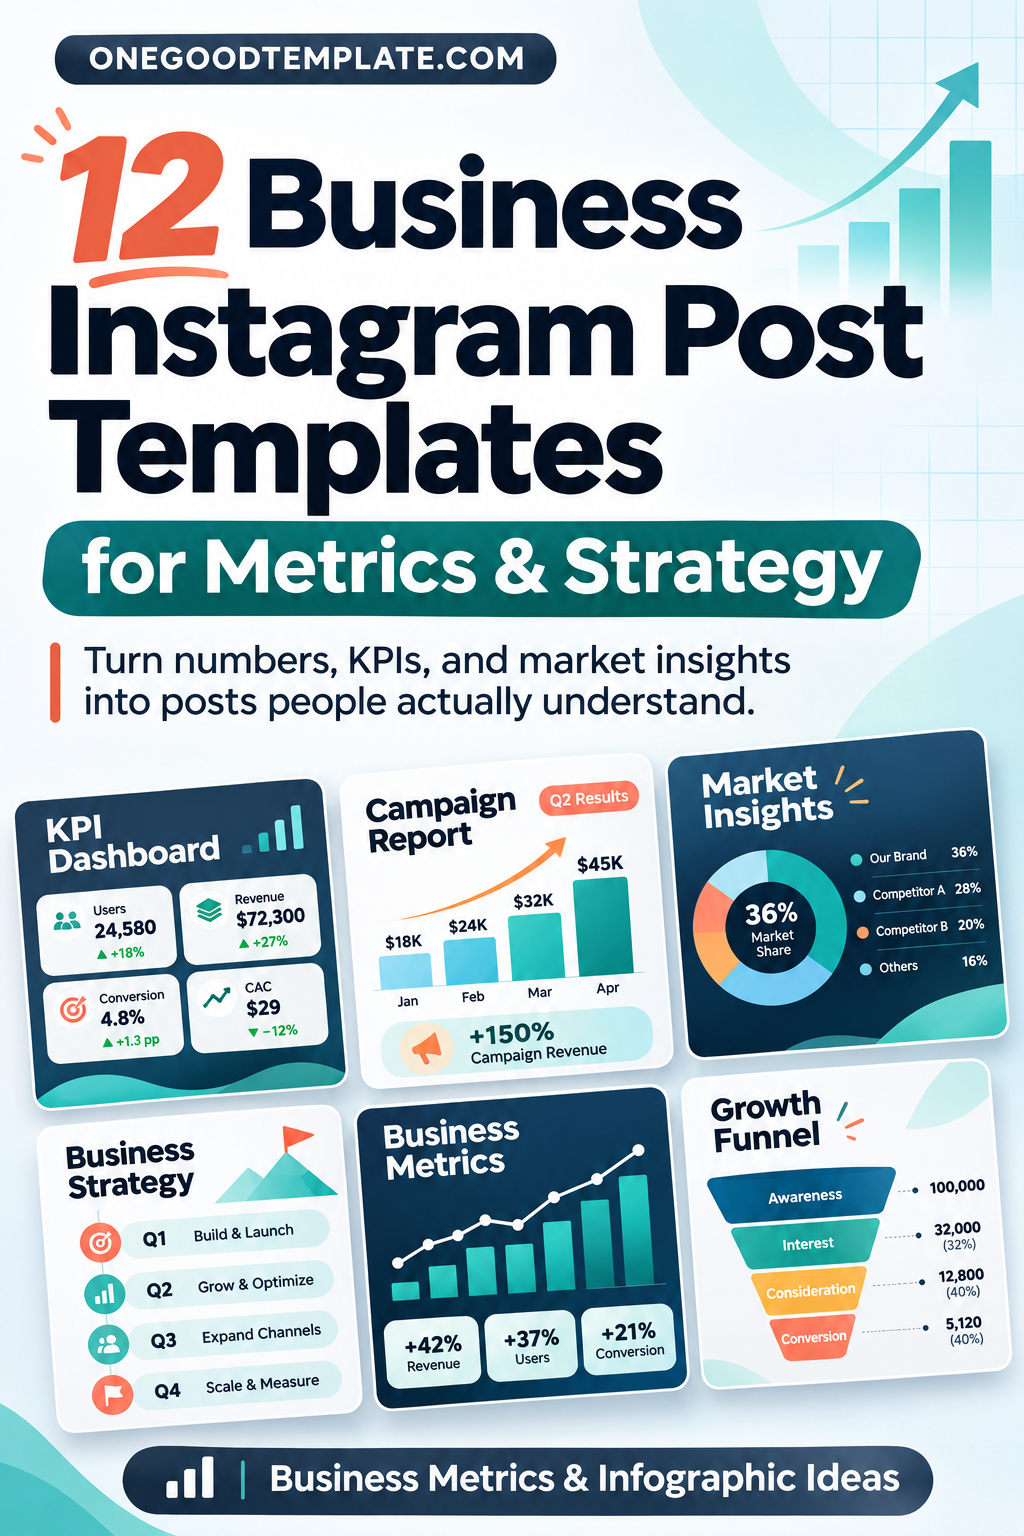
12 Instagram templates that turn business metrics, strategies, and ideas into posts people can actually understand.
A percentage can look impressive and still tell your audience almost nothing.
A 68% increase in what? Over which period? And why should anyone outside your business care?
Numbers need context. Whether you’re reporting campaign results, introducing a software tool, or explaining a growth strategy, a clear visual can help people see what matters without making them study an entire presentation.
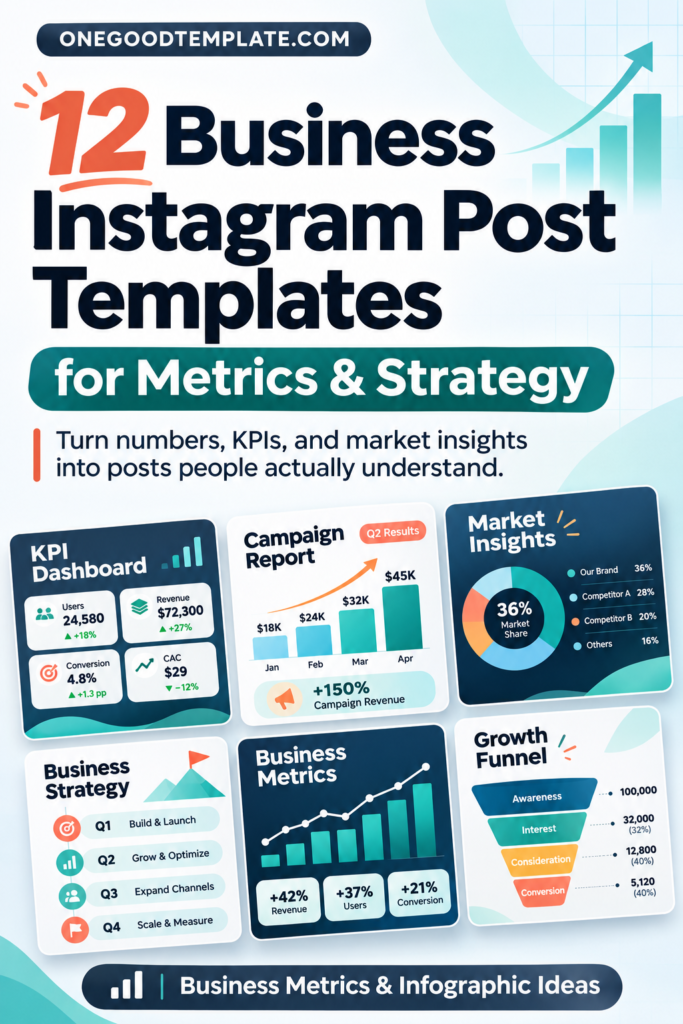
That’s the idea behind this collection of 12 business Instagram post templates.
Some of these designs put percentages and charts front and center. Others make a workflow, a service offer, or a business decision easier to follow. What connects them is simple: they help people understand your work without asking them to study a full presentation.
Quick Picks: Find the Right Design for Your Business Message
Start with what you need your next post to communicate.
- Show Campaign Results Clearly: Campaign Performance Social Media
- Explain Workflow Automation: Workflow Management Social Media Pack
- Make Project Tools Easier to Understand: Project Management Social Media Template
- Turn Business Data Into Decisions: Business Insights Instagram Post Pack
- Present Growth Metrics & Frameworks: Compound Business Strategy Instagram
- Highlight Market Opportunities: Market Value – Instagram Post
- Share Tech Trends & Research: Future Tech Instagram Post
- Explain the Value Behind Your Work: Business Value – Instagram Post
- Connect Brand Strategy to Results: Brand Impact Instagram Post
- Make Your Sales Process Clearer: Business B2B B2C Sales Instagram Post
- Publish Regular Market Updates: Monitor Market Value Instagram Post
- Give Business Posts a Lighter Look: White Green Market Value Instagram Post
1. Campaign Performance Social Media
Let Your Campaign Results Tell a Better Story

A marketing agency can say it delivers results. Showing what actually happened is far more convincing.
Campaign Performance Social Media gives those results a bold visual setting. Coral-red panels, deep navy backgrounds, creamy accents, and oversized numbers make campaign statistics feel like the highlights of a business case rather than another spreadsheet summary.
The layouts include circular infographic elements, team photography, and prominent performance figures. They’re particularly useful when you want to explain how a campaign performed, what changed, and which decisions helped shape the outcome.
Picture a three-post sequence: introduce the campaign challenge, present the key results, and explain what your team learned. A potential client gets more than a collection of impressive percentages. They get a glimpse of how your agency thinks.
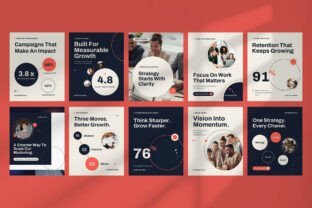

You receive 10 editable Instagram posts at 1080 × 1350 pixels, with AI, EPS, PSD, and Canva formats. Text, colors, and graphic elements can be customized.
The example numbers are demonstration content, not verified campaign achievements. Replace them with your own accurate data, and bring your own photography because the background images aren’t included.
2. Workflow Management Social Media Pack
Give Your Productivity Software a More Energetic First Impression

A workflow platform might help a team spend less time on repetitive tasks. But how do you communicate that benefit in an Instagram post without filling the screen with tiny interface screenshots?
This collection takes an energetic approach.
Electric-blue highlights, dark navy panels, neon-green accents, and oversized typography give the designs a distinctly tech-focused personality. Feature blocks and pricing layouts help organize messages about automation, team collaboration, and subscription plans.
For a software startup, that opens up several useful content ideas: explain a workflow feature, introduce a new pricing plan, show how team members coordinate tasks, or announce a product update.
Instead of presenting a long feature list, give each post one job. One can explain the problem your tool addresses. Another can introduce the relevant feature. A third can show the next step for someone interested in trying the product.
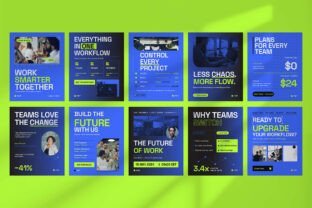
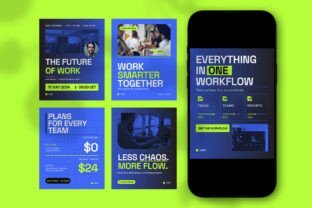
The pack contains 10 portrait layouts at 1080 × 1350 pixels, with editable AI, EPS, PSD, and Canva files. You’ll need to replace the sample photography with your own visuals.
3. Project Management Social Media Template
Make a Complicated Product Feel Easy to Understand

Project management software deals with deadlines, assignments, schedules, and a dozen moving parts. Its Instagram presence doesn’t need to look equally complicated.
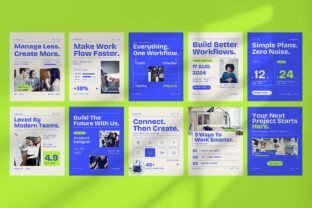
Project Management Social Media Template uses light cream and white backgrounds, bright blue headlines, and lime accents to create a more open, approachable presentation.
Team photographs and organized content blocks give you room to introduce features without overwhelming someone who has never used your product.
Consider a series for new users. Begin with the problem of keeping tasks organized, explain how your platform handles project planning, and follow with a post about teamwork or subscription options.

The goal isn’t to prove that your software has every feature imaginable. It’s to help a potential customer understand where it could fit into an ordinary workday.
There are 10 editable posts at 1080 × 1350 pixels, supplied in AI, EPS, PSD, and Canva formats. The background images shown in the examples aren’t included.
4. Business Insights Instagram Post Pack
Give Every Important Number a Clear Takeaway

A dashboard tells you what’s happening. A good business insight explains what deserves attention.
That’s the territory of Business Insights Instagram Post Pack.
Black-and-white layouts, cobalt-blue accents, bright yellow details, large statistics, and circular charts create a sharp, analytical look. The designs have room for topics such as market position, growth priorities, operating signals, and business risks.
A consultant could use one post to highlight a change in revenue, another to explain a market signal, and a third to show what that information means for the next business decision.
The difference lies in the conclusion. Instead of publishing a chart and leaving readers to interpret it, pair the evidence with a simple explanation of why it matters.
The collection includes 10 editable portrait posts at 1080 × 1350 pixels in AI, EPS, and PSD formats. Canva isn’t listed, and the demonstration photographs aren’t supplied.
5. Compound Business Strategy Instagram
Present Your Growth Strategy With More Authority
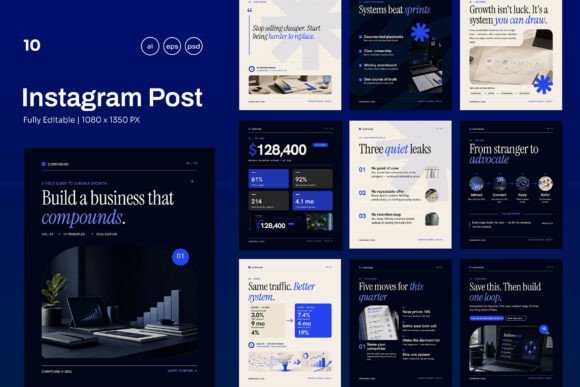
A growth chart can show that revenue changed. It can’t explain which decisions led there.
That’s where a good strategy post earns its place: connecting the numbers to the priorities, choices, and next steps behind them.
Compound Business Strategy Instagram gives this material a serious editorial treatment. Deep navy backgrounds, warm cream panels, vivid blue accents, and expressive serif typography make the layouts resemble pages from a modern business publication.
For a growth consultant or B2B agency, the collection could support a series about performance indicators, strategic priorities, or the steps involved in solving a client challenge.
Start with a business goal. Show the main obstacle. Then explain the approach your team recommends and how you’ll measure whether it’s working.
The reader doesn’t just see a growth number. They understand the reasoning behind the plan.

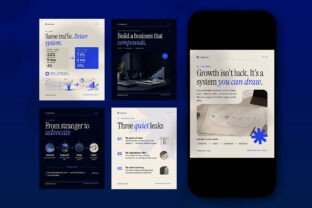
The package provides 10 editable layouts at 1080 × 1350 pixels in AI, EPS, and PSD formats. Sample business photography isn’t included, so use your own approved images where needed.
6. Market Value – Instagram Post
Make Your Market Opportunities Easier to See

A promising business opportunity can disappear inside a paragraph full of financial language.
Market Value – Instagram Post takes a more expressive approach, with blue-purple backgrounds, white space, lime and orange-red accents, and bold typography.
The energetic palette makes sense for consultants, financial brands, and agencies presenting market opportunities, business value, or investment-related ideas.
A post might introduce a market shift, another could explain why that change matters to a particular industry, and a third could outline the business opportunity your team is studying.
For example, instead of posting a vague statement about a growing market, explain which segment is growing, over what period, and what the change could mean for a specific type of company.


The templates use 1080 × 1350 pixel portrait layouts and include editable AI, EPS, and PSD files, along with information about the free font used.
The product listing doesn’t confirm the number of individual layouts. It also notes that the demonstration images and mockups aren’t included.
7. Future Tech Instagram Post
Explain Emerging Technology Without the Buzzword Fog

Artificial intelligence. Automation. New digital systems. Every week seems to bring another claim that technology will change everything.
For a company publishing research or industry observations, the useful question is simpler: what has changed, and why does it matter?
Future Tech Instagram Post is designed for that kind of communication.
Dark navy and light editorial layouts alternate with electric-blue accents, large statistics, charts, and technology-focused imagery. The result feels closer to a digital industry magazine than a conventional software advertisement.
An AI startup could explain a relevant industry trend. A technology consultant might break down a research finding. A digital publication could turn a longer report into a short sequence of visual highlights.
The designs work especially well when you have actual information to share — a measurable trend, a meaningful comparison, or an observation supported by reliable research.

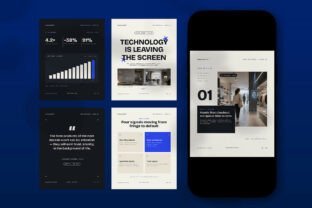
You get 10 editable 1080 × 1350 pixel posts in AI, EPS, and PSD formats. Background photography isn’t included, and Canva isn’t listed among the supplied formats.
8. Business Value – Instagram Post
Help Clients Understand Why Your Work Matters
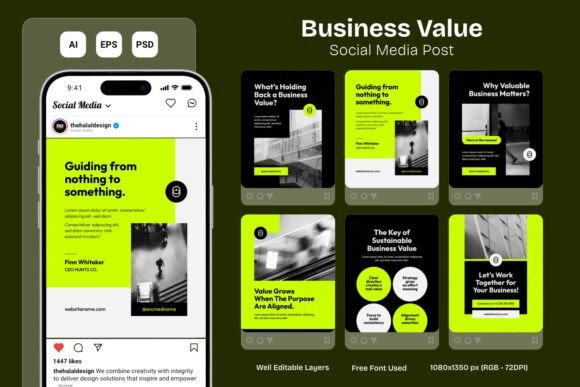
What exactly is someone paying for when they hire your business?
The answer isn’t always a product or a neatly measured result. Sometimes it’s better decisions, a clearer direction, or a process that helps people work toward the same goal.
That’s the role I’d give Business Value – Instagram Post: explaining what your service helps clients accomplish, how your team approaches the work, and why those decisions matter.
A B2B consultant could build a series around three questions: What problem are we solving? How do we approach it? What will the client gain from the work?
One post might introduce a common business challenge. Another could explain the steps involved in a project. A third could connect those steps to the client’s goals.
This is especially useful for services whose value isn’t immediately visible in a product photograph. The posts help potential clients understand what they’re paying for before a sales conversation begins.
The listing identifies editable AI, EPS, and PSD files for 1080 × 1350 pixel Instagram posts, but doesn’t confirm the number of layouts. Demonstration images are not included.
9. Brand Impact Instagram Post
Show the Thinking Behind a Stronger Brand

A finished logo can look beautiful. It doesn’t tell the whole story of why a branding project mattered.
Brand Impact Instagram Post gives creative agencies room to explain that missing part.
Black and cream backgrounds, coral, blue, and turquoise accents, large editorial statements, and team imagery create a confident visual style. The layouts bring brand positioning, campaign insights, content strategy, and selected metrics into the same conversation.
For a branding studio, that’s a chance to build a more meaningful case study.
You could introduce a client’s original positioning problem, explain the strategy behind the new direction, and show an approved outcome or relevant campaign signal.
The result is a portfolio story with a reason behind the design choices. Potential clients see more than attractive work — they begin to understand the expertise that shaped it.
The collection contains 10 editable portrait posts at 1080 × 1350 pixels in AI, EPS, and PSD formats. Photography from the previews isn’t included, making genuine project imagery especially valuable.
10. Business B2B B2C Sales Instagram Post
Make the Next Step Obvious to Potential Clients

Someone visits your business profile. They like what they see. Then comes the awkward question: what exactly do you offer, and how do they get started?
If the answer is buried under vague marketing language, a polished Instagram feed won’t solve the problem.
Business B2B B2C Sales Instagram Post focuses on making commercial messages easier to follow.
Black backgrounds, bright purple accents, business photography, and circular graphics give the layouts a confident sales-oriented style. They’re suited to service introductions, sales processes, offers, and client-facing explanations.
A consultant could introduce a service package, explain the stages of working together, and finish with a clear invitation to get in touch.
A software business might use a similar sequence to describe its product, show where it fits into a workflow, and explain how to begin.
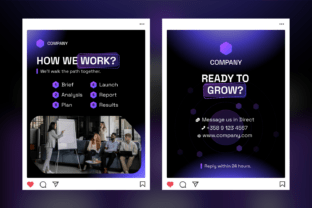

The set includes six editable layouts intended for Instagram, LinkedIn, and Facebook. Files include Photoshop PSD templates and a PDF with a Canva editing link, plus supporting materials and free-font information.
You’ll need your own photographs, since the demonstration images aren’t included.
11. Monitor Market Value Instagram Post
Give Your Market Updates a Recognizable Format

Market information rarely arrives as one dramatic announcement. More often, it changes gradually.
A new figure this month. A shift in the next quarter. A pattern that only becomes obvious after several updates.
For financial consultants and analysts who publish regularly, consistency matters. Readers should be able to recognize an update and understand what has changed without learning a completely new layout each time.
Monitor Market Value Instagram Post is positioned around that recurring task.
The package contains 12 Photoshop PSD templates with Smart Objects — editable placeholders that make it easier to replace images or graphics while keeping the surrounding layout intact.
That makes it a practical starting point for a weekly market update, a monthly review of selected indicators, or an ongoing series about business value.
The most useful approach is to keep the structure familiar: identify the period, show the current figure, compare it with an appropriate reference point, and explain the takeaway.
The seller also mentions CC0 imagery, but check the actual files and usage terms before relying on particular photographs.
12. White Green Market Value Instagram Post
Bring a Lighter Touch to Business Communication

Not every business wants the visual personality of a financial institution.
A small consulting company may prefer something more approachable, especially when its Instagram combines service information, practical advice, and business updates.
For a smaller B2B brand, white-and-green business graphics could offer a welcome change from dark corporate designs — especially when the goal is to explain a service or share a practical market observation.
White Green Market Value Instagram Post is positioned around this lighter approach to business communication.
Consider a simple three-part content sequence: what challenge does your client face, how does your approach help, and what should someone understand before getting in touch?
You could also use a recurring format for short market observations or business updates, giving followers something familiar to recognize from one post to the next.
The package is listed as a collection of 12 Photoshop PSD templates. The seller also mentions CC0 imagery.
Because the full visual gallery hasn’t been verified, it’s worth inspecting the actual compositions before choosing this product for a particular brand. The important question is whether the layouts give your real messages enough space and clarity.
How to Choose Business Instagram Post Templates for Clearer Communication
A business Instagram post doesn’t need to explain everything. It needs to make one useful idea easier to understand.
That sounds obvious, but it’s surprisingly easy to forget when a design comes with attractive charts, large numbers, and enough decorative elements to fill a presentation.
Before choosing a collection, consider these three things.
Give Each Post One Clear Takeaway
Start by finishing this sentence:
After reading this post, I want someone to understand…
Maybe you want potential clients to see how a campaign performed. Perhaps you’re explaining why your software helps organize tasks, or showing what a market change could mean for businesses.
Choose the layout after you’ve identified that message.
For a performance post, one strong number with a short explanation may be more useful than six unrelated statistics. For a business process, three clear stages can communicate more than a crowded diagram.
If you can’t summarize the point in one sentence, the content may need more than one post.
Match the Visual Format to the Information
Different business messages need different kinds of visuals.
A line chart is useful when you want to show how a number changes over time. Bars make it easier to compare categories. A sequence of connected steps works better for explaining a workflow or customer journey.
But not every business post needs a chart.
A pricing announcement may need clear service details. A strategic insight might work best as a strong headline followed by a brief explanation. A client case study may need a combination of numbers, photographs, and context.
When browsing Instagram infographic templates, pay attention to what each visual makes easiest to understand. A good-looking chart isn’t much help if it hides the comparison your reader actually needs.
The right design doesn’t simply make information look impressive. It helps readers understand what they’re looking at.
Check the Files and Test the Design on Your Phone
Before choosing a template, check which editing software it requires.
Some collections offer Canva alongside Photoshop and Illustrator files. Others rely on PSD, AI, or EPS formats. A design is only convenient if you can edit it comfortably.
Look at dimensions, editable text, image placeholders, and the number of included layouts. Don’t assume that the photographs shown in promotional previews come with the files.
Finally, replace the example headline and numbers with your own content.
Open the result on your phone. Can you read the main figure? Do the chart labels make sense? Is the takeaway obvious without zooming in?
If not, simplify the layout before publishing.
Frequently Asked Questions
What business metrics should I share on Instagram?
Choose numbers that help your intended audience understand something meaningful about your work.
A marketing agency might share campaign reach, leads generated, cost per lead, or conversion rates. A software business could explain product adoption or usage trends. A consultant might highlight a relevant business indicator or an approved client outcome.
Always include enough context to make the figure useful. A percentage without a timeframe or reference point can easily create the wrong impression.
How can I show client results without revealing confidential information?
Start by checking what the client has agreed you may share. Even accurate figures can be confidential.
If permission allows, an anonymized case study may explain the original challenge, your approach, and an approved result without identifying the company.
You can also focus on the decision-making process rather than publishing sensitive financial information.
Never invent figures to fill an attractive infographic. A truthful explanation without numbers is better than a convincing design built around false ones.
Do business Instagram posts always need charts and graphs?
No. A chart is useful when it helps someone see a comparison, a trend, or a relationship between numbers.
For a software introduction, a simple workflow may communicate the message better. A business consultant might use a short framework — a structured way of explaining an idea — or a clear statement supported by a relevant example.
Use charts when the data needs them, not because the template has an empty chart-shaped space.
Can I edit these business Instagram templates without Photoshop?
Yes, some collections in this roundup include Canva editing options.
Campaign Performance Social Media, Workflow Management Social Media Pack, and Project Management Social Media Template list Canva among their supported formats. Business B2B B2C Sales Instagram Post also includes a Canva editing link supplied through a PDF.
Other products use formats such as PSD, AI, or EPS, which require compatible design software.
Check the exact files on each product page before choosing. Canva availability for one collection doesn’t mean every template in this roundup supports it.
Can I use the same business graphics on Instagram and LinkedIn?
Often, yes — but check the dimensions and content before publishing.
A graphic designed for Instagram may need a different crop or text arrangement for another platform. Labels that look readable in a full-size editing window can become too small in a feed preview.
Business B2B B2C Sales Instagram Post is specifically marketed for Instagram, LinkedIn, and Facebook. For other collections, confirm the supported formats and adapt the layouts as needed.
Final Thoughts
Business metrics are only useful when people understand what they mean. Whether you’re presenting a campaign result, explaining a workflow, or sharing a market insight, the right design helps the message reach the reader.
Start with what you want someone to understand. Use accurate numbers, give them enough context, and choose a layout that makes the point easy to follow. The best business post isn’t necessarily the one with the biggest chart — it’s the one that leaves people knowing something they didn’t know before.